Zone Maps
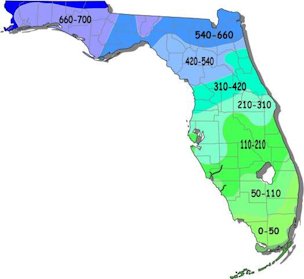
Florida Chill Hours Map
The University of Florida Institute of Food and Agricultural Science
(UF-IFAS) tabulates chill hours (as opposed to average minimum
temperature) in more detail for Florida and their map can be used to
identify the expected range of chill hours for areas in Florida.
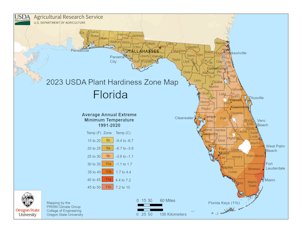
Be sure to match your plants by Hardiness Zone and by Chill Hours.
In order to bloom in spring, deciduous fruit trees like peaches, plums,
and nectarines all must go through the plant equivalent of a long
winter's nap.
They need a dormancy period with a certain number of chilling hours,
when the temperature drops below 45 degrees Fahrenheit. The exact
number of chilling hours depends on the fruit tree variety, but it can
be anywhere from a hundred to more than a thousand.
Here in Florida, gardeners should look for special "low chill" fruit
tree varieties. Low-chill peaches, plums, and nectarines need just 100
to 525 chilling hours per year, making them better suited for our mild
winters. Low-chill apples are also available, though there are fewer
varieties that work well in Florida. 1

Fig. 1 
Chill Hour
Accumulation in Florida

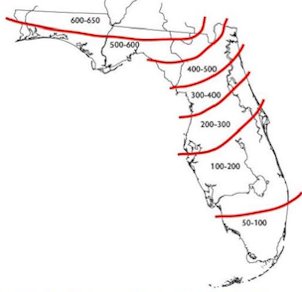
Fig. 2 
Below 45F (7.2C) through February 10th
There are many sources from which to gather this data, including the
Florida Automated Weather Network FAWN. The state of Florida has
several zones with different chill unit accumulations to aid in
selecting a peach cultivar. 2
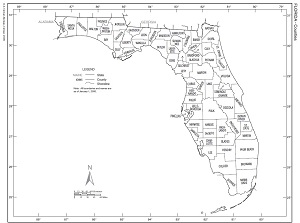
Counties of Florida Map

Fig. 3 
Plant
Hardiness Zone Map

Fig. 4 
Back to
General Index Page
|
|
Bibliography
1 "Chill Hours Map." Gardening
Solutions, UF/IFAS, 23 Oct. 2013, gardeningsolutions.ifas.ufl.edu//plants/edibles/fruits/chill-hours.html.
Accessed 10 Aug. 2016.
2 Sarkhosh, Ali, et al.
"Florida Peach and Nectarine
Varieties." Horticultural
Sciences Dept., (originally
published in 1995 as "Peaches and Nectarines for Central and North
Florida), Circ. 1159, UF/IFAS Extension, Original
pub. Nov. 1995, Rev. May 2013, June 2016 and Oct.
2018, Reviewed 19 Oct. 2022, AskIFAS,
doi.org/10.32473/edis-mg374-2013, edis.ifas.ufl.edu/mg374.
Accessed 16 Feb. 2017, 2 Apr. 2019, 2 Apr. 2024.
Illustrations
Fig. 1 "Florida Chill Hours Map." UF/IFAS, ifas.ufl.edu.
Accessed 12 Apr. 2014.
Fig. 2 "Chill Hour Accumulation in Florida
(Below 45F [7.2C] through February 10th)." Outline map courtesy of the Florida State Historical Society, edis.ifas.ufl.edu. Accessed
16 Apr. 2015.
Fig. 3
"State Based County Outline Map -
Florida. General Reference Maps." United States Cencus Bureau, 7 Oct.
2002,
www.census.gov/geographies/reference-maps/2000/geo/state-county-outline-2000.html.
Accessed 9 Aug. 2016.
Fig. 4 "USDA Plant Hardiness Zone Map Florida."
Florida-Friendly Landscaping™ Program, UF/IFAS, 2023, ffl.ifas.ufl.edu/resources/usda-hardiness-zones/. Accessed 9 Aug. 2016, 2 Apr. 2024.
Published 19 Feb 2013 KJ. Last update 2 Apr. 2024 LR
|


